Measured vs Modelled
At one time the extreme heat of the late 19th century as well as the mid 1930's to early 1940's was well known and taught in secondary schools. The latter period was followed by a massive increase in man's CO2 emissions due to industrialization and economic prosperity following WWII.
But as CO2 in the atmosphere went from 310PPM in 1937 to 334PPM in 19791, average temperatures cooled significantly for decades. There was even concern from some scientists about global cooling2,3. From about 1980 onward average temperatures began to rise again.
This was problematic for those pushing the theory that man's CO2 emissions were driving a warming climate. In 2009 "Climategate"4 erupted over leaked emails between anthropogenic global warming proponents Phil Jones, Keith Briffa, and Mike Hulme. They called the warming of the 1930's to 1940's "the blip" and "problematic". They pondered what to do about it.
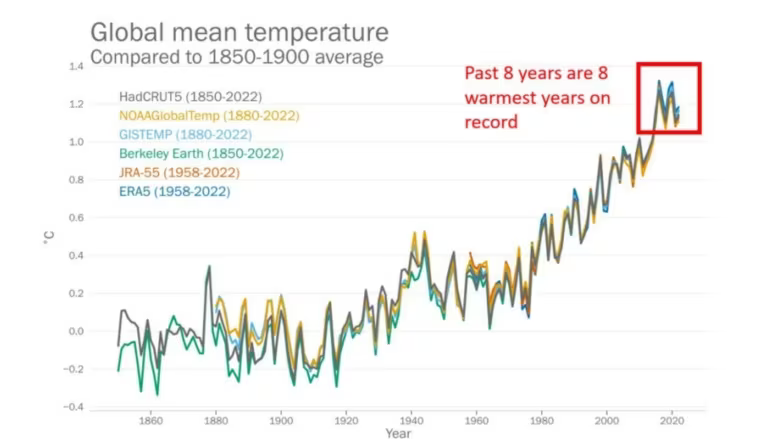
The answer was clear. They had to hide "the blip", and hide it they did. When you see a news article today that displays an historical temperature graph it no longer shows measured historical data. Instead it shows modelled data. The same models used to predict warming due to increasing CO2 levles is used to cool the past. The chart below is an example of a modelled graph masquerading as fact.
This site, however, uses measured data from Environment Canada5. It shows that while it certainly is warm now, of that there is no doubt, it was just as warm (and in many cases warmer) back when CO2 in the atmostphere was only between 310PPM and 334PPM. Today it is at 423PPM1.
Modelled Chart (i.e. not real)
2. https://archive.org/details/sim_noaa-national-oceanic-and-atmospheric-administration_1974-10_4_4
3. https://www.newspapers.com/image/294615037/?terms=world%20climate%20conference&match=1
4. https://web.archive.org/web/20150310114031/https://www.wsj.com/articles/SB10001424052748704779704574553652849094482
5. https://collaboration.cmc.ec.gc.ca/cmc/climate/Get_More_Data_Plus_de_donnees/